 Parler
 Gab
Gab
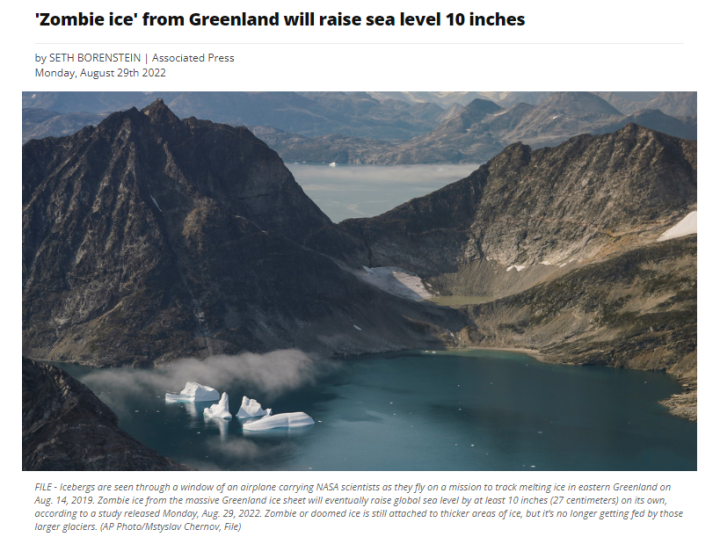 Other headlines such as this one in the Washington Post are less ridiculous.
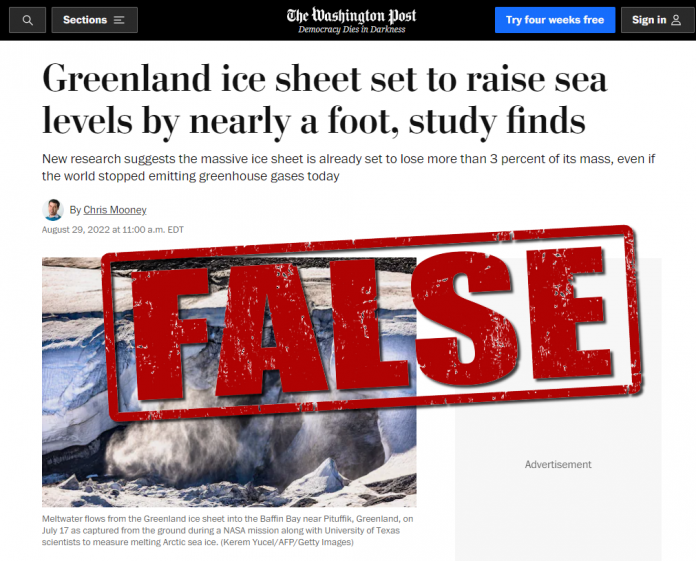 On Monday, August 29, 2022, The Washington Post (WaPo) made a claim that melting ice on the Greenland ice sheet would raise global sea level by one foot by the year 2050 or possibly 2100. This is false, and easily disproven.
One of the favorite scare stories that has continued to circulate about effects of climate change is the never-ending alarm over future sea level rise. Back in 1989, when today’s catch-all phrase of “climate change” was known as “global warming,” there was this prediction from the United Nations (UN) covered in an Associated Press story.
“A senior U.N. environmental official says entire nations could be wiped off the face of the Earth by rising sea levels if the global warming trend is not reversed by the year 2000.”
That claim voiced by the UN official was based on computer models projecting future sea levels. Obviously, the models were wrong, because that claim never happened. Today, 22 years past the due date, not one country, not even a city, has been “wiped off the face of the Earth by rising sea levels.”
Today, we have the same old scare story; computer models designed and interpreted by humans who fully believe what they programmed, are used to make a scare story in major media.
First, let’s look at the claim in the headline: Greenland ice sheet set to raise sea levels by nearly a foot, study finds
Sounds dire, doesn’t it? Surely some low-level places built right next to the sea would be flooded if that happened.
In the body of the story, they say this, bolds mine:
Human-driven climate change has set in motion massive ice losses in Greenland that couldn’t be halted even if the world stopped emitting greenhouse gases today, according to a new study published Monday. The findings in Nature Climate Change project that it is now inevitable that 3.3 percent of the Greenland ice sheet will melt — equal to 110 trillion tons of ice, the researchers said. That will trigger nearly a foot of global sea-level rise. The predictions are more dire than other forecasts, though they use different assumptions. While the study did not specify a time frame for the melting and sea-level rise, the authors suggested much of it can play out between now and the year 2100.There is no time frame specified for the one foot of claimed rise? How can peer-reviewed climate science be so imprecise? 110 trillion tons of ice? That sounds unimaginably large, and most people can’t even begin to understand the magnitude of that. For most people, the number alone is scary. First let’s tackle the big scary “110 trillion tons of ice” number that will supposedly be melted. In our companion website, Climate at a Glance (CAAG) we have already debunked this issue in Climate at a Glance: Greenland Ice Melt. The key point to consider is this: When recent ice loss is compared to the full Greenland ice sheet, the loss is so small that it is almost undetectable. Over the past couple of decades, claims of ice melt in Greenland have been used to bolster fears of runaway sea-level rise. For example, NASA scientists said the following about the Greenland and Antarctic ice sheets: “The two regions have lost 6.4 trillion tons of ice in three decades; unabated, this rate of melting could cause flooding that affects hundreds of millions of people by 2100.” Although several trillion tons of ice sounds like massive ice loss, it amounts to less than 1 percent of Greenland’s total ice mass. As shown in Figure 1, the total ice loss each year is nearly undetectable, coming in at just 0.005 percent of the Greenland ice sheet. [caption id="" align="alignnone" width="592"]
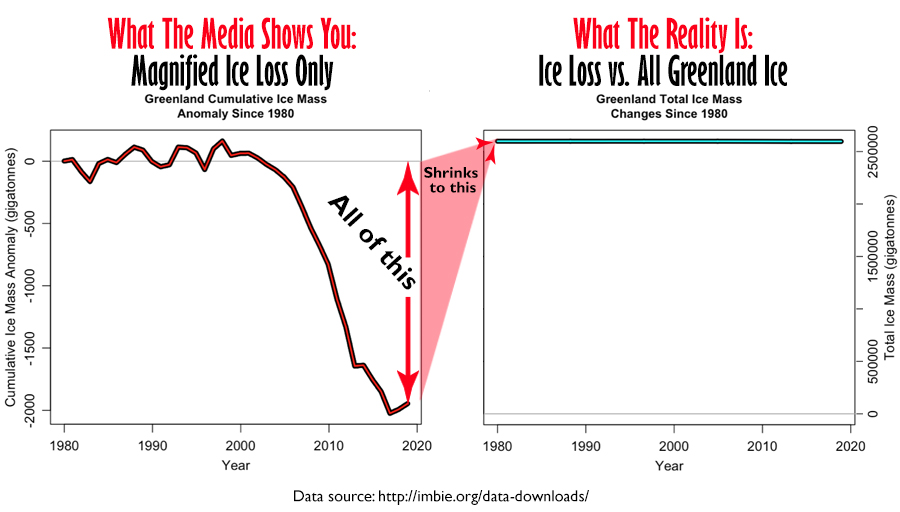 Figure 1. A comparison of presentations of satellite data capturing Greenland’s ice mass loss. The image on the right shows changes in Greenland’s ice mass relative to Greenland’s total ice mass. Sources: The data plotted in these graphs are from the Ice Sheet Mass Balance Inter-Comparison Exercise, a joint exercise by NASA and the European Space Agency.4 Graphs originally by Willis Eschenbach. Adapted and annotated by Anthony Watts.[/caption]
As you can see, even if the 3% number projected by the computer model for some time in the future were to actually come true, it is still miniscule compared to all of the ice in Greenland.
But, there are two very important real-world things that are not covered in the new study. The first is weather patterns, and the second is black carbon soot.
Weather patterns, not climate change, determine if ice will melt in Greenland or not. In July 2021 alarm was raised about a one-day weather event in Greenland during the summer when cloud cover lifted and the sun came out, melting the surface layer.
Greenland: Enough Ice Melted on Single Day to Cover Florida in Two Inches of Water, claimed The Guardian. It was yet another climate scare-story, and what they didn’t tell you was that the very next day, all that melted water re-froze when the clouds returned. The water never made it to the ocean.
The new study cited by WaPo simply doesn’t factor in weather patterns, but assumes a simple linear causation from carbon dioxide in the atmosphere warming the planet enough to cause enough melt to raise sea-level by a foot sometime in the future, maybe by 2050, maybe by 2100 – they aren’t sure as both dates were used in the article.
The other factor not considered is black carbon soot being deposited on the Greenland ice sheet. Both forest fires and increased industrialization factor into that soot. The black carbon soot absorbs more sunlight, thus increasing heat retention from sunlight, and enhances melting. Another peer reviewed study says Asia’s booming coal based economy is a primary cause of the soot being deposited in the Arctic, including Greenland. They say:
Snow and sea ice are two of the most reflective surfaces occurring naturally on planet Earth. Light absorbing aerosols, such as wind blown black carbon, that stick to these pristine surfaces can make them less reflective, thus converting more sunlight into heat. The added heat leads to increased surface temperatures and is detrimental to the Arctic climate.Note in the Figure 1 graph how the ice melt really doesn’t start until around the year 2001. If climate change was really the cause, you would be seeing ice melt all the way back to 1980, because global carbon dioxide levels have been steadily increasing and supposedly warming the planet since then. What really happened around the year 2001 becomes abundantly clear in Figure 2. [caption id="" align="alignnone" width="598"]
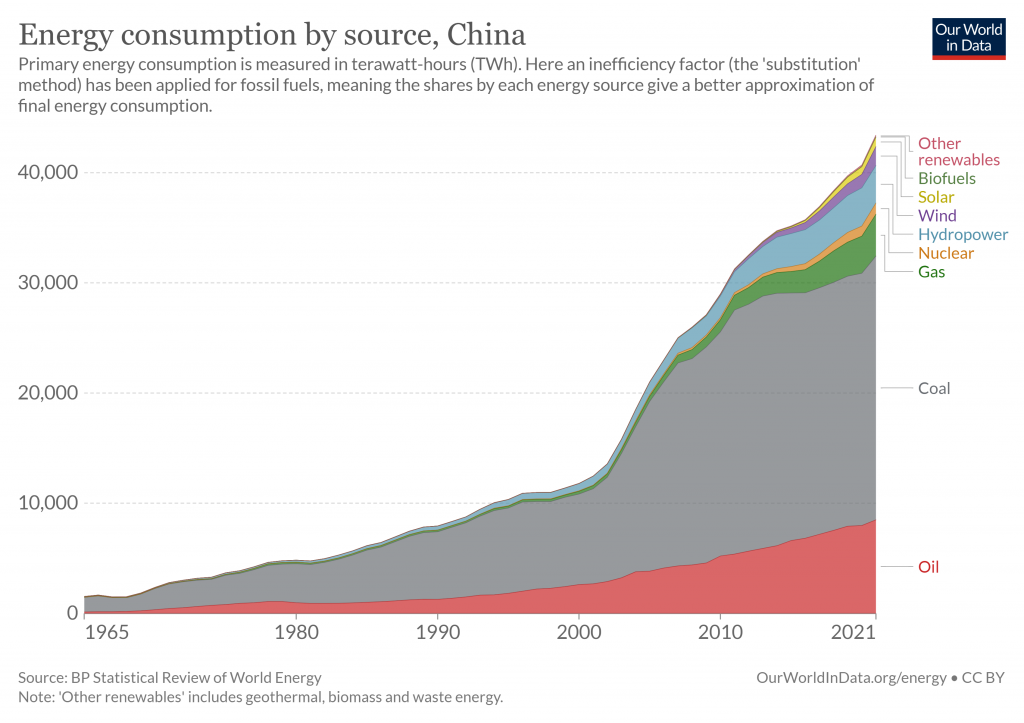 Figure 2. Source: Our World in Data, China energy mix. https://ourworldindata.org/grapher/energy-consumption-by-source-and-region?stackMode=absolute&country=~CHN[/caption]
Figure 2 shows China’s use of coal really took off around 2001, and as most anyone knows, coal produces significant amounts of soot when burned, which is why it has been dubbed as a “dirty fuel.” It doesn’t take a PhD in climate science to notice the clear correlation between China’s coal use, soot production, and Greenland ice melt post 2001.
The new study cited by WaPo misses that completely. What will happen in the future if China uses less coal and produces less soot?
Finally, let’s run the numbers so far and without the aid of billion-dollar supercomputers, we can make our own simple math model for projecting sea level rise into the future. From Climate at a Glance: Sea Level Rise we have these numbers:
Global sea level has been rising since at least the mid-1800s, and data show there has been only minor recent acceleration. NASA satellite instruments, with readings dating back to 1993, show global sea level rising at a pace of merely 1.2 inches per decade, even post 2001 with the additional melt from Greenland.
So, if we choose 2050 as the end date for the purported 1 foot of sea level rise the math works out to be:
2050-2022= 28 years. We’ll round that to three decades.
3 decades x 1.2”/decade = 3.6” by 2050
Or for the year 2100 we have:
2100-2022= 78 years. We’ll round that to eight decades.
8 decades x 1.2”/decade = 9.6” by 2100
No matter what end date you choose, you still can’t get to 1 foot of sea level rise cited by the study. And since the study can’t even put a date in place for that, nor do they consider soot, weather patterns, or changes to energy production, especially in China, the study is little more than an exercise in guessing wrapped up in a peer-reviewed paper to give sort of sense of credulity for unquestioning reporters.
And here is something the zombie, er, one-track-mind reporters like Seth Borenstein and Chris Mooney won’t tell you. “The Greenland ice sheet gained a record-breaking 7 gigatons of snow/ice yesterday, the most during any summer month since the early-1980s. Journos are selective, they’ll report on a day of record melt, but you can bet your hard-earned dollar this won’t make any major headlines.” (h/t Chris Martz on Twitter)
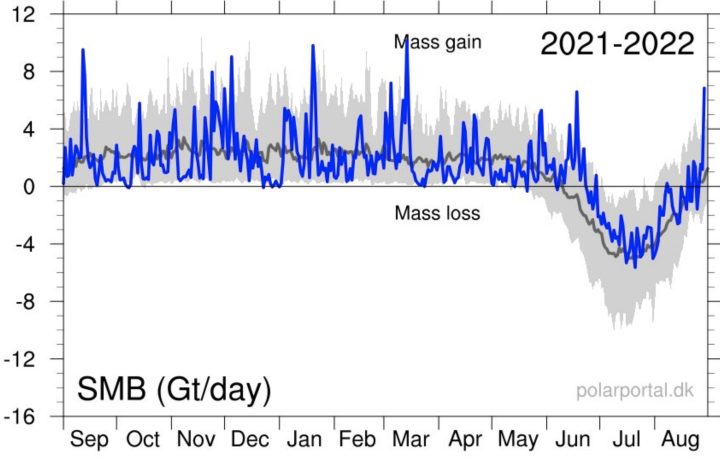 Looking back to the impossible, irresponsible, and falsified sea-level claim made in 1989, the present day articles from WaPo and AP reminds me of the greatest quote from Yogi Berra ever: ‘It’s Deja Vu All Over Again’
Note: Some parts of this essay originally appeared on Climate Realism – Anthony
Read more at: TheConservativeTreehouse.com
Ben Armstrong: Pfizer knows COVID vaccine is dangerous for pregnant women
By Kevin Hughes // Share
It’s not even close: Study finds more bots are promoting pro-Ukraine propaganda
By Ramon Tomey // Share
Governments continue to obscure COVID-19 vaccine data amid rising concerns over excess deaths
By patricklewis // Share
Tech giant Microsoft backs EXTINCTION with its support of carbon capture programs
By ramontomeydw // Share
Germany to resume arms exports to Israel despite repeated ceasefire violations
By isabelle // Share
